Difference between revisions of "Monitor economy"
Jump to navigation
Jump to search
| Line 14: | Line 14: | ||
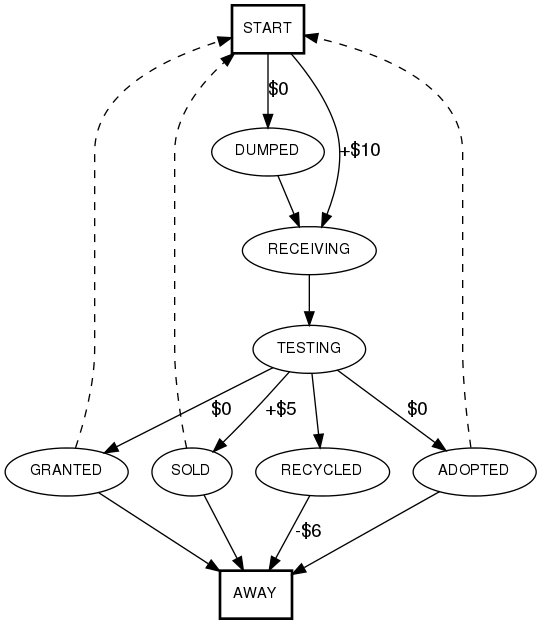
start -> receiving [label="$0\n(dumped)"] | start -> receiving [label="$0\n(dumped)"] | ||
| − | start -> receiving [label="+$10\n(normal)"] | + | start -> receiving [label="+$10\n(normal)\n13,702"] |
| − | receiving -> testing [label="$0\n(pass) 35%"] | + | receiving -> testing [label="$0\n(pass) 4,796 (35%)"] |
| − | receiving -> recycled [label="-$6\n(fail) 65%"] | + | receiving -> recycled [label="-$6\n(fail) 8,906 (65%)"] |
testing -> recycled [label="-$6\n(bad)"] | testing -> recycled [label="-$6\n(bad)"] | ||
| − | testing -> sold [label="+$6.39\n(good-sale)"] | + | testing -> sold [label="+$6.39\n(good-sale)\n2,213"] |
| − | testing -> granted [label="$0\n(good-grant)"] | + | testing -> granted [label="$0\n(good-grant)\n402"] |
| − | testing -> adopted [label="$0\n(good-adopt)"] | + | testing -> adopted [label="$0\n(good-adopt)\n365"] |
sold -> start [style="dashed"] | sold -> start [style="dashed"] | ||
Revision as of 12:33, 11 July 2008
Still need to know:
- Average sale price
- How many are dumped
- Percentage of received that are:
- Sold
- Granted
- Adopted
- Recycled