Difference between revisions of "Key gizmo analysis"
Jump to navigation
Jump to search
| Line 1: | Line 1: | ||
| − | + | We need to fill this out for each key type of gizmo we handle. Fill in the name of the gizmo up top, then on each line we need how many gizmos on average we handle (per month). We need current numbers and projected numbers (one year out). | |
| + | |||
| + | Today's date: _____________ | ||
| + | |||
| + | Type of Gizmo: | ||
| + | * [_] Systems [_] Laptops [_] Macintoshes | ||
| + | * [_] Printers [_] LCDs [_] Other: _____________ | ||
| + | |||
| + | Please label the chart with numbers in this form: | ||
| + | * Current -> Projected | ||
| + | |||
<graphviz> | <graphviz> | ||
digraph d { | digraph d { | ||
| Line 28: | Line 38: | ||
} | } | ||
</graphviz> | </graphviz> | ||
| − | |||
| − | |||
| − | |||
| − | |||
| − | |||
| − | |||
| − | |||
| − | |||
| − | |||
| − | |||
| − | |||
| − | |||
| − | |||
| − | |||
| − | |||
| − | |||
| − | |||
| − | |||
| − | |||
| − | |||
| − | |||
| − | |||
| − | |||
| − | |||
| − | |||
| − | |||
| − | |||
| − | |||
| − | |||
| − | |||
| − | |||
[[Category: Big Picture]] | [[Category: Big Picture]] | ||
Revision as of 17:40, 8 September 2009
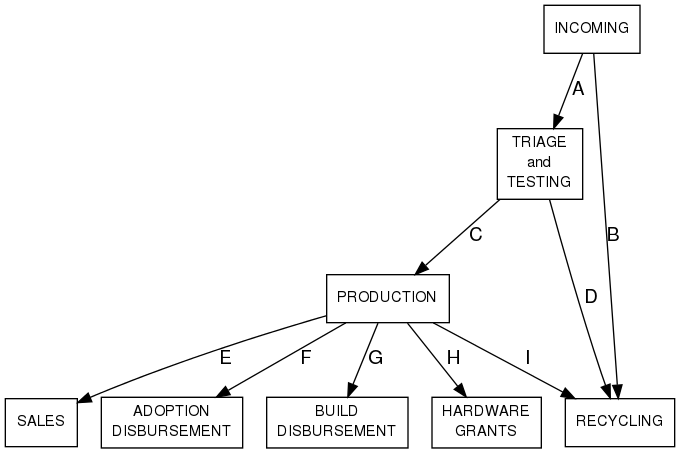
We need to fill this out for each key type of gizmo we handle. Fill in the name of the gizmo up top, then on each line we need how many gizmos on average we handle (per month). We need current numbers and projected numbers (one year out).
Today's date: _____________
Type of Gizmo:
- [_] Systems [_] Laptops [_] Macintoshes
- [_] Printers [_] LCDs [_] Other: _____________
Please label the chart with numbers in this form:
- Current -> Projected