Difference between revisions of "System Evaluation Big Picture"
Jump to navigation
Jump to search
(New page: <graphviz> digraph Eval2 { node [fontname="Helvetica", fontsize="11"] edge [fontname="Helvetica"] start [label="START HERE", style="bold"] main [label="The\nMAIN CHART\nhe...) |
|||
| Line 1: | Line 1: | ||
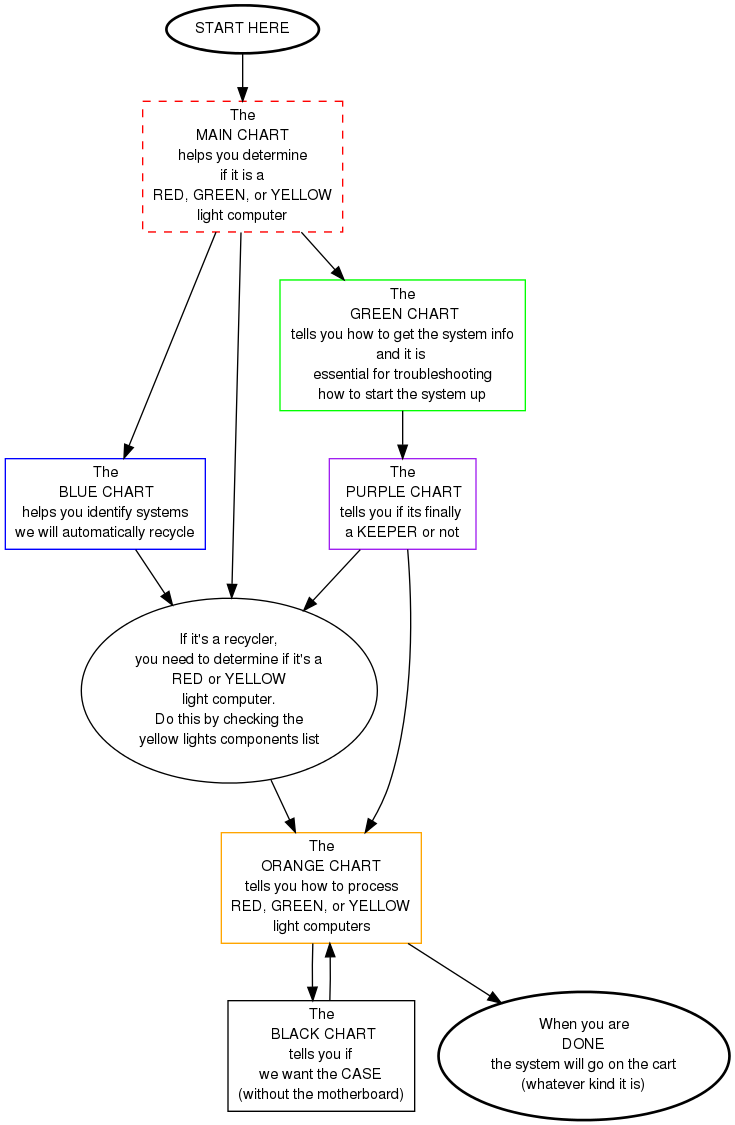
| + | This is a '''general overview''' of the system evaluation flow charts. Do not take it too literally. | ||
| + | |||
<graphviz> | <graphviz> | ||
digraph Eval2 { | digraph Eval2 { | ||
| Line 10: | Line 12: | ||
blue [label="The\n BLUE CHART\nhelps you identify systems\nwe will automatically recycle", shape="box", color="blue"] | blue [label="The\n BLUE CHART\nhelps you identify systems\nwe will automatically recycle", shape="box", color="blue"] | ||
green [label="The\n GREEN CHART\ntells you how to get the system info\nand it is \nessential for troubleshooting\nhow to start the system up", shape="box", color="green"] | green [label="The\n GREEN CHART\ntells you how to get the system info\nand it is \nessential for troubleshooting\nhow to start the system up", shape="box", color="green"] | ||
| + | red_yellow [label="If it's a recycler,\nyou need to determine if it's a\nRED or YELLOW\nlight computer.\nDo this by checking the\nyellow lights components list", color="black"] | ||
purple [label="The\n PURPLE CHART\ntells you if its finally \na KEEPER or not", shape="box", color="purple"] | purple [label="The\n PURPLE CHART\ntells you if its finally \na KEEPER or not", shape="box", color="purple"] | ||
black [label="The\n BLACK CHART\ntells you if\nwe want the CASE\n(without the motherboard)", shape="box", color="black"] | black [label="The\n BLACK CHART\ntells you if\nwe want the CASE\n(without the motherboard)", shape="box", color="black"] | ||
| − | done [label=" | + | done [label="When you are\nDONE\nthe system will go on the cart\n(whatever kind it is)", style="bold"] |
| − | start -> main -> orange -> done | + | start -> main -> red_yellow -> orange -> done |
| − | main -> blue -> | + | main -> blue -> red_yellow |
| − | main -> green -> purple -> | + | main -> green -> purple -> red_yellow |
| + | purple -> orange | ||
orange -> black -> orange | orange -> black -> orange | ||
Revision as of 15:36, 22 July 2010
This is a general overview of the system evaluation flow charts. Do not take it too literally.