Difference between revisions of "System Evaluation Big Picture"
| (One intermediate revision by the same user not shown) | |||
| Line 1: | Line 1: | ||
| + | == Introduction == | ||
This is a '''general overview''' of the system evaluation flow charts. Do not take it too literally. | This is a '''general overview''' of the system evaluation flow charts. Do not take it too literally. | ||
| + | |||
| + | The process takes place in two broad parts. [[Image:Stoplight.png|right]] | ||
| + | |||
| + | ;The first part | ||
| + | :is covered by the main chart (and associated charts) and that is where we try to determine the class of computer. There are three classes, coded ''red light, yellow light, and green light:'' | ||
| + | |||
| + | : Essentially, old computers we want no (or very few) parts from are coded ''red light''. Computers we'd like to re-use are coded ''green light''. Computer in between are ''yellow lights'' and we want to mine them heavily for parts, even though we're not interested in the computer as a whole. | ||
| + | |||
| + | ;The second part | ||
| + | :is covered by the orange chart (and associated charts) and that is where we actually pull the parts out of the computer. What parts get pulled depends on the class of computer (above). | ||
| + | |||
| + | == About yellow and red lights == | ||
| + | |||
| + | Once a system has been determined to be a recycler (not a keeper), then it is either a red or a yellow light system. To determine this, we usually look at the yellow lights component list. If the computer has anything from that list in it, it is a yellow light system. Otherwise it's a red light system. | ||
| + | |||
| + | ''You can think of the yellow light components list as a list of flags. (If even one of these things is present, then the rest of the components are probably worth pulling out.)'' | ||
| + | |||
| + | You will hit the yellow lights components list twice in many cases. The first time will be to determine if it is a yellow light system or not. The second time will be for yellow light systems only and will be to guide the user in what parts to pull out of the system. | ||
| + | |||
| + | == Overview == | ||
<graphviz> | <graphviz> | ||
Latest revision as of 12:49, 23 July 2010
Introduction
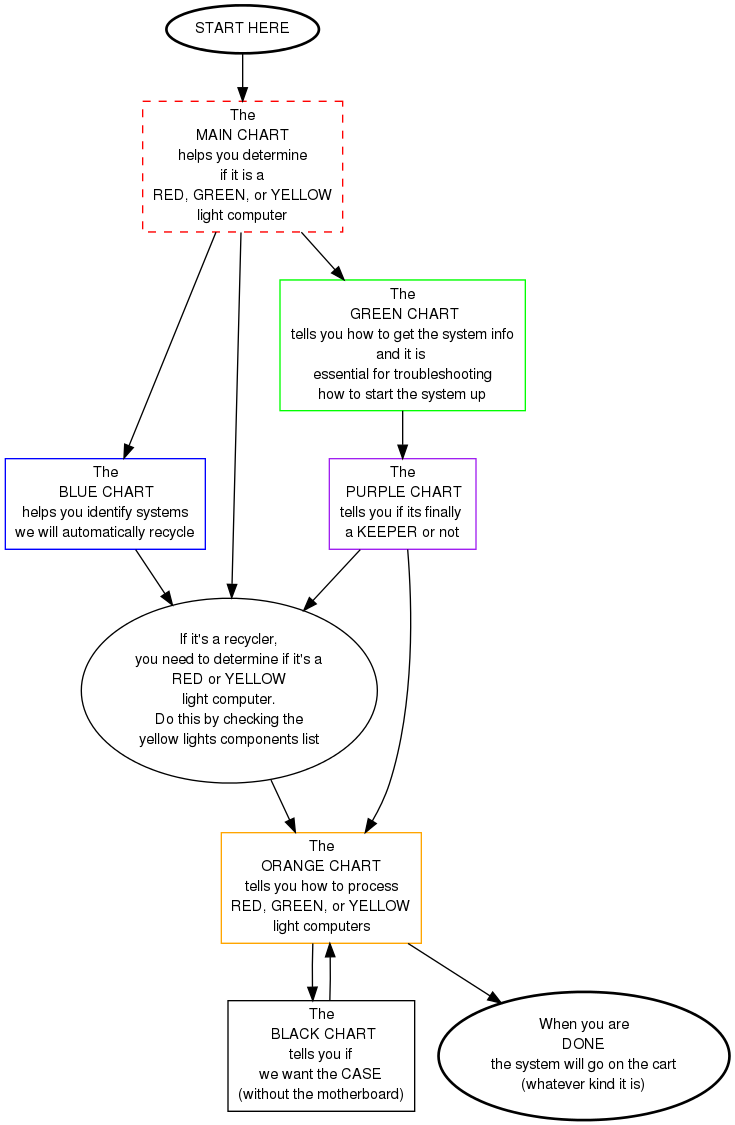
This is a general overview of the system evaluation flow charts. Do not take it too literally.
The process takes place in two broad parts.

- The first part
- is covered by the main chart (and associated charts) and that is where we try to determine the class of computer. There are three classes, coded red light, yellow light, and green light:
- Essentially, old computers we want no (or very few) parts from are coded red light. Computers we'd like to re-use are coded green light. Computer in between are yellow lights and we want to mine them heavily for parts, even though we're not interested in the computer as a whole.
- The second part
- is covered by the orange chart (and associated charts) and that is where we actually pull the parts out of the computer. What parts get pulled depends on the class of computer (above).
About yellow and red lights
Once a system has been determined to be a recycler (not a keeper), then it is either a red or a yellow light system. To determine this, we usually look at the yellow lights component list. If the computer has anything from that list in it, it is a yellow light system. Otherwise it's a red light system.
You can think of the yellow light components list as a list of flags. (If even one of these things is present, then the rest of the components are probably worth pulling out.)
You will hit the yellow lights components list twice in many cases. The first time will be to determine if it is a yellow light system or not. The second time will be for yellow light systems only and will be to guide the user in what parts to pull out of the system.
Overview