Difference between revisions of "Monitor economy"
Jump to navigation
Jump to search
m (User:RfS/Other Other Scratch Page moved to Monitor economy) |
|||
| (11 intermediate revisions by the same user not shown) | |||
| Line 1: | Line 1: | ||
| − | |||
<graphviz> | <graphviz> | ||
digraph D { | digraph D { | ||
| Line 7: | Line 6: | ||
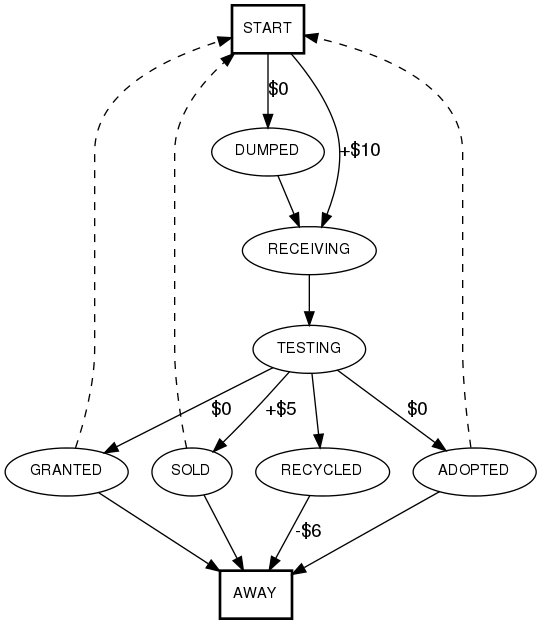
start [label="START", shape="box", style="bold"] | start [label="START", shape="box", style="bold"] | ||
| − | receiving [label="RECEIVING"] | + | receiving [label="RECEIVING\n13,702\n@ $9.80 = $134,280"] |
testing [label="TESTING"] | testing [label="TESTING"] | ||
| − | recycled [label="RECYCLED", shape="box", style="bold"] | + | recycled [label="RECYCLED\n10,722\n@ -$6.00 = -$82,212", shape="box", style="bold"] |
| − | sold [label="SOLD", shape="box", style="bold"] | + | sold [label="SOLD\n2,213\n@ +$6.39 = +$14,142", shape="box", style="bold"] |
granted [label="GRANTED", shape="box", style="bold"] | granted [label="GRANTED", shape="box", style="bold"] | ||
adopted [label="ADOPTED", shape="box", style="bold"] | adopted [label="ADOPTED", shape="box", style="bold"] | ||
| − | start -> receiving [label="$0\n(dumped)"] | + | start -> receiving [label="$0\n(dumped)\n274 (2%)"] |
| − | start -> receiving [label="+$10\n(normal)"] | + | start -> receiving [label="+$10\n(normal)\n13,428 (98%)"] |
| − | receiving -> testing [label="$0\n(pass)"] | + | receiving -> testing [label="$0\n(pass)\n4,796 (35%)"] |
| − | receiving -> recycled [label="-$6\n(fail)"] | + | receiving -> recycled [label="-$6\n(fail)\n8,906 (65%)"] |
| − | testing -> recycled [label="-$6\n(bad)"] | + | testing -> recycled [label="-$6\n(bad)\n1,816"] |
| − | testing -> sold [label="+$ | + | testing -> sold [label="+$6.39\n(good-sale)\n2,213"] |
| − | testing -> granted [label="$0\n(good-grant)"] | + | testing -> granted [label="$0\n(good-grant)\n402"] |
| − | testing -> adopted [label="$0\n(good-adopt)"] | + | testing -> adopted [label="$0\n(good-adopt)\n365"] |
sold -> start [style="dashed"] | sold -> start [style="dashed"] | ||
Latest revision as of 13:26, 11 July 2008
Still need to know:
- Average sale price
- How many are dumped
- Percentage of received that are:
- Sold
- Granted
- Adopted
- Recycled