Difference between revisions of "Monitor economy"
Jump to navigation
Jump to search
| Line 6: | Line 6: | ||
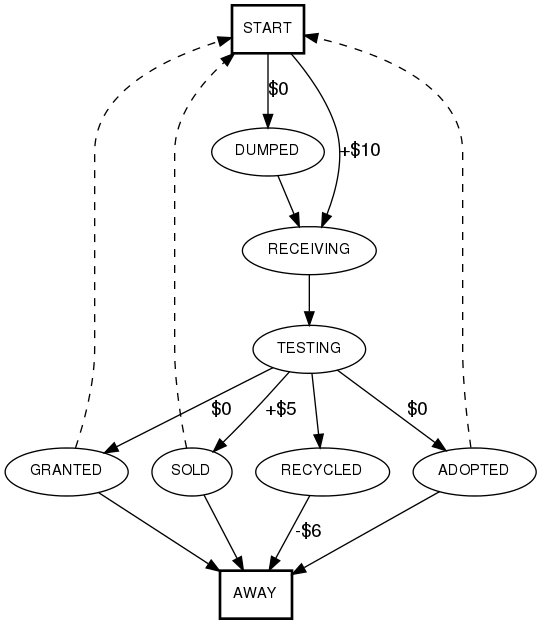
start [label="START", shape="box", style="bold"] | start [label="START", shape="box", style="bold"] | ||
| − | receiving [label="RECEIVING\n13,702\n@ $9.80 = $ | + | receiving [label="RECEIVING\n13,702\n@ $9.80 = $134,280"] |
testing [label="TESTING"] | testing [label="TESTING"] | ||
| − | recycled [label="RECYCLED\n10,722", shape="box", style="bold"] | + | recycled [label="RECYCLED\n10,722\n@ -$6.00 = -$82,212", shape="box", style="bold"] |
sold [label="SOLD", shape="box", style="bold"] | sold [label="SOLD", shape="box", style="bold"] | ||
granted [label="GRANTED", shape="box", style="bold"] | granted [label="GRANTED", shape="box", style="bold"] | ||
Revision as of 13:22, 11 July 2008
Still need to know:
- Average sale price
- How many are dumped
- Percentage of received that are:
- Sold
- Granted
- Adopted
- Recycled