Difference between revisions of "System Evaluation Visual Triage"
Jump to navigation
Jump to search
| Line 1: | Line 1: | ||
__NOTOC__ | __NOTOC__ | ||
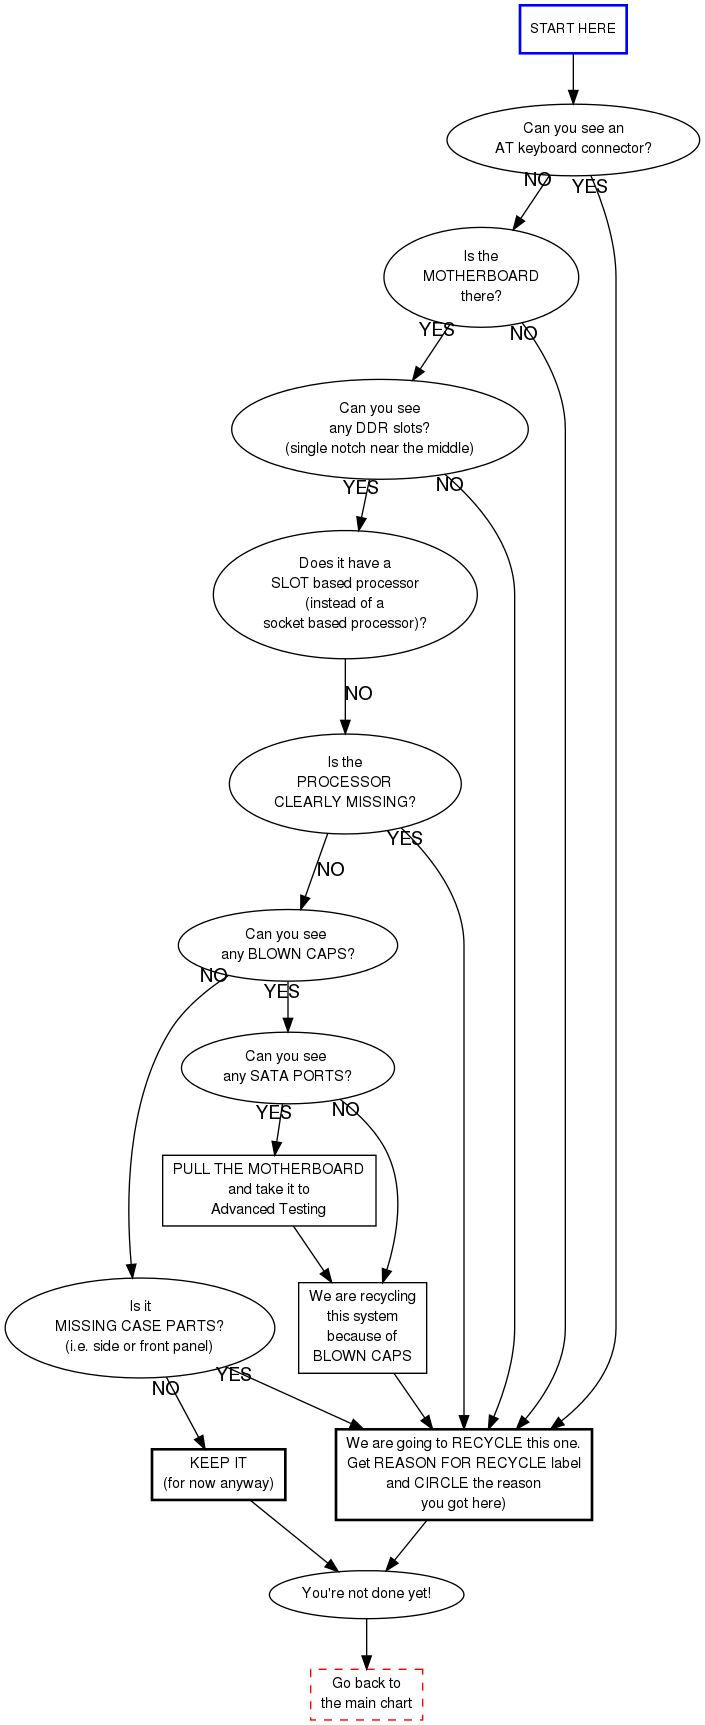
==BLUE Chart== | ==BLUE Chart== | ||
| + | <div style="border: 10px solid BLUE; padding: .5em 1em; color: #000; margin: 3px 3px 0;"> | ||
<graphviz> | <graphviz> | ||
| Line 71: | Line 72: | ||
} | } | ||
</graphviz> | </graphviz> | ||
| + | </div> | ||
[[Category: System Evaluation]] | [[Category: System Evaluation]] | ||
Revision as of 08:00, 29 May 2009
BLUE Chart