Difference between revisions of "Case Management Overview"
Jump to navigation
Jump to search
(put name of chart on two lines to match system evaluation 2 overview) |
(turned triage into system evalulation triage 1) |
||
| Line 16: | Line 16: | ||
tallyit [label="Copy info\nfrom label to\nTALLY SHEET", fontsize="11", shape="box"] | tallyit [label="Copy info\nfrom label to\nTALLY SHEET", fontsize="11", shape="box"] | ||
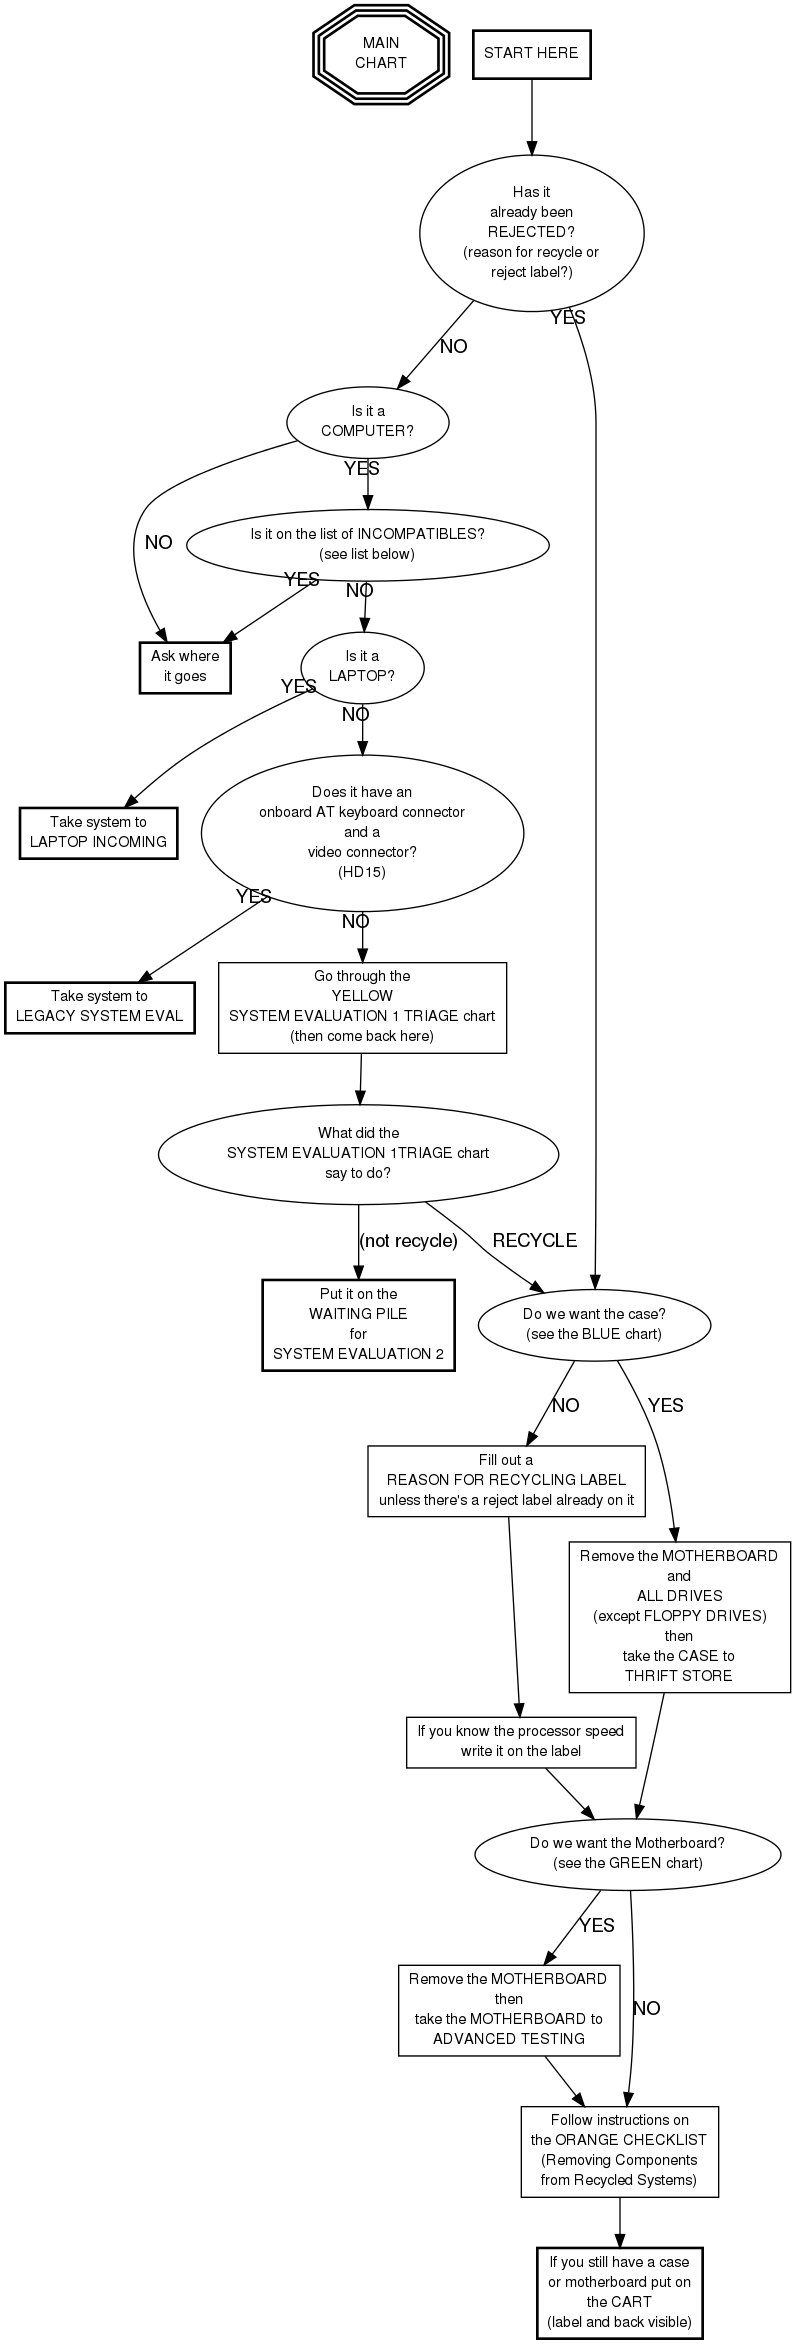
triage [label="Go through the\nSYSTEM EVALULATION 1 TRIAGE chart\n(then come back here)", shape="box", fontsize="11", URL="/index.php?title=System_Evaluation_1_Triage"] | triage [label="Go through the\nSYSTEM EVALULATION 1 TRIAGE chart\n(then come back here)", shape="box", fontsize="11", URL="/index.php?title=System_Evaluation_1_Triage"] | ||
| − | triageoutcome [label="What did | + | triageoutcome [label="What did the\nSYSTEM EVALULATION 1TRIAGE chart\nsay to do?", fontsize="11"] |
whitehole [label="Take it to the\nWHITE HOLE", fontsize="11", shape="box", style="bold"] | whitehole [label="Take it to the\nWHITE HOLE", fontsize="11", shape="box", style="bold"] | ||
waiting [label="Put it on the\nWAITING PILE\nfor System Eval 2\nLabel with # of\nRAM slots", fontsize="11", URL="/index.php?title=System_Evaluation_2_Overview", shape="box", style="bold"] | waiting [label="Put it on the\nWAITING PILE\nfor System Eval 2\nLabel with # of\nRAM slots", fontsize="11", URL="/index.php?title=System_Evaluation_2_Overview", shape="box", style="bold"] | ||
Revision as of 14:09, 8 January 2006